Trusted by Virginia DOTs & Counties

Analyze 5 Years of Crash Data in 2 Hours, Not 2 Weeks

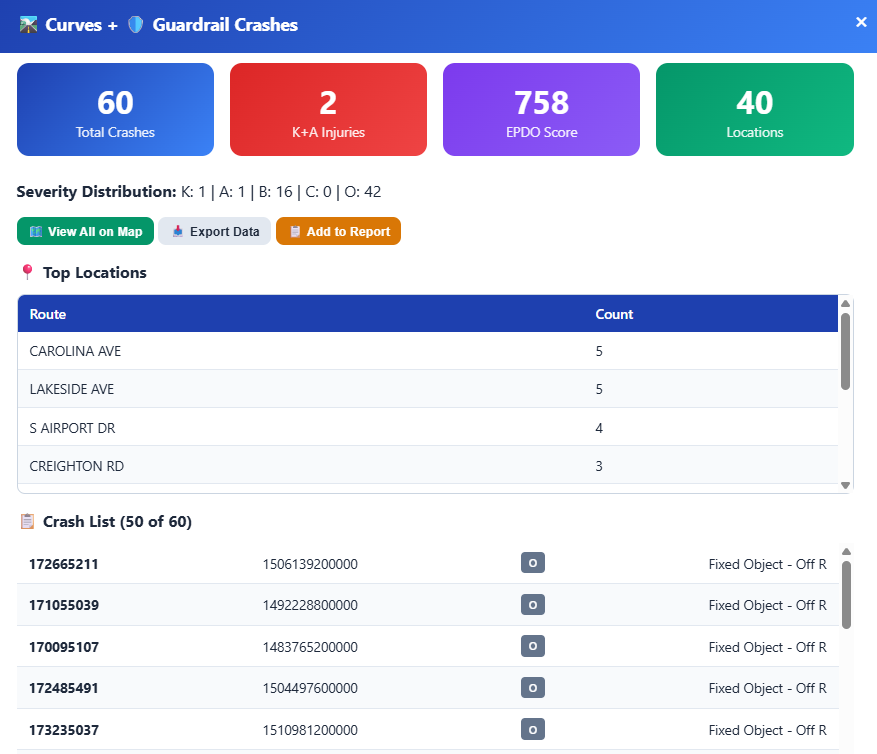
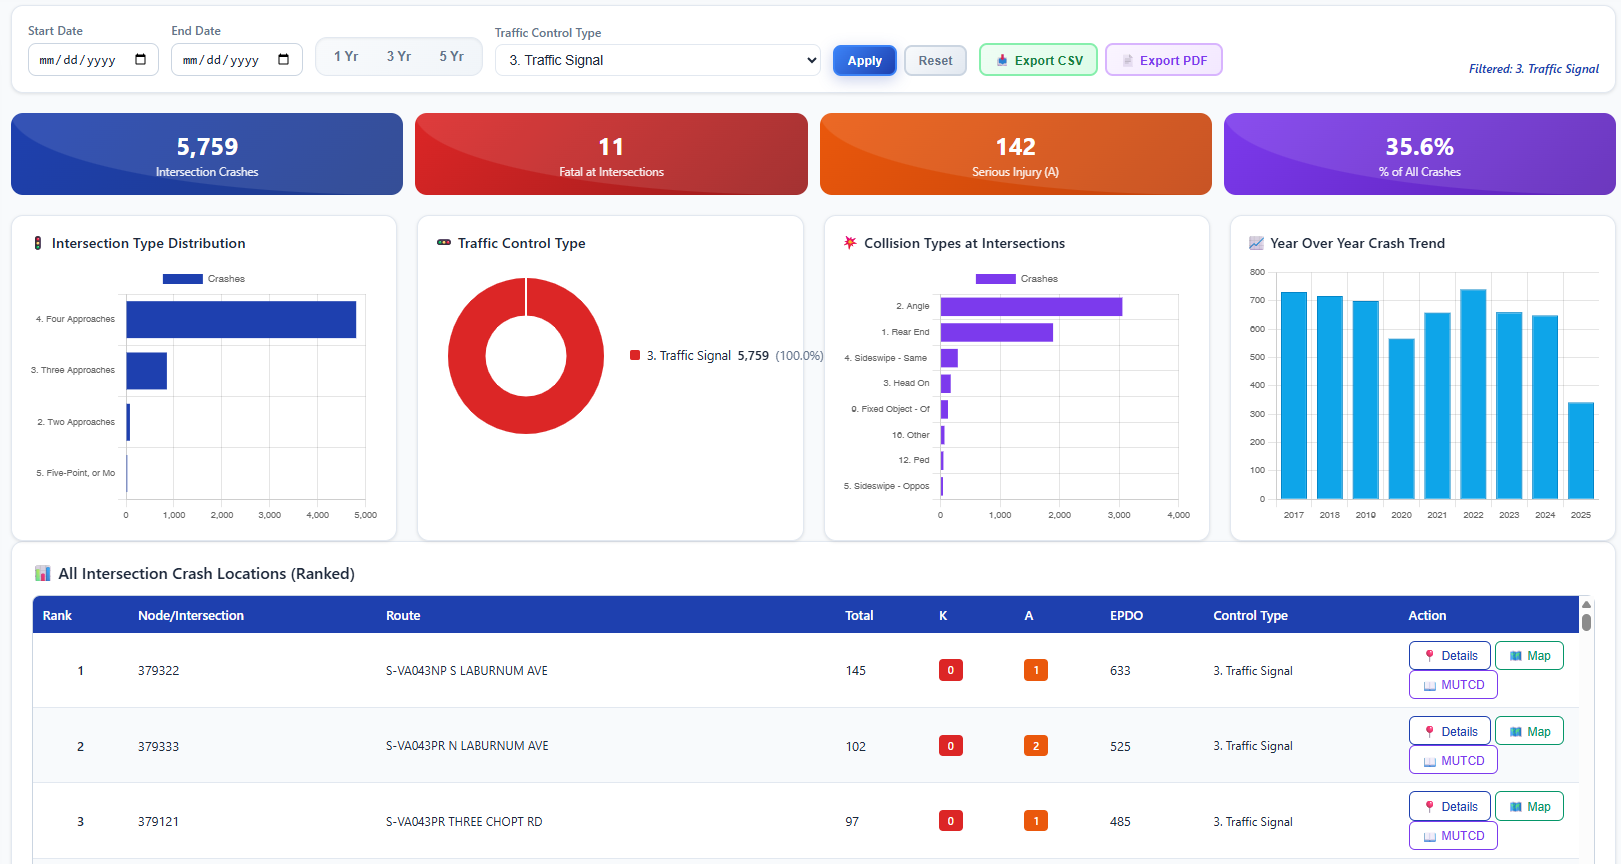
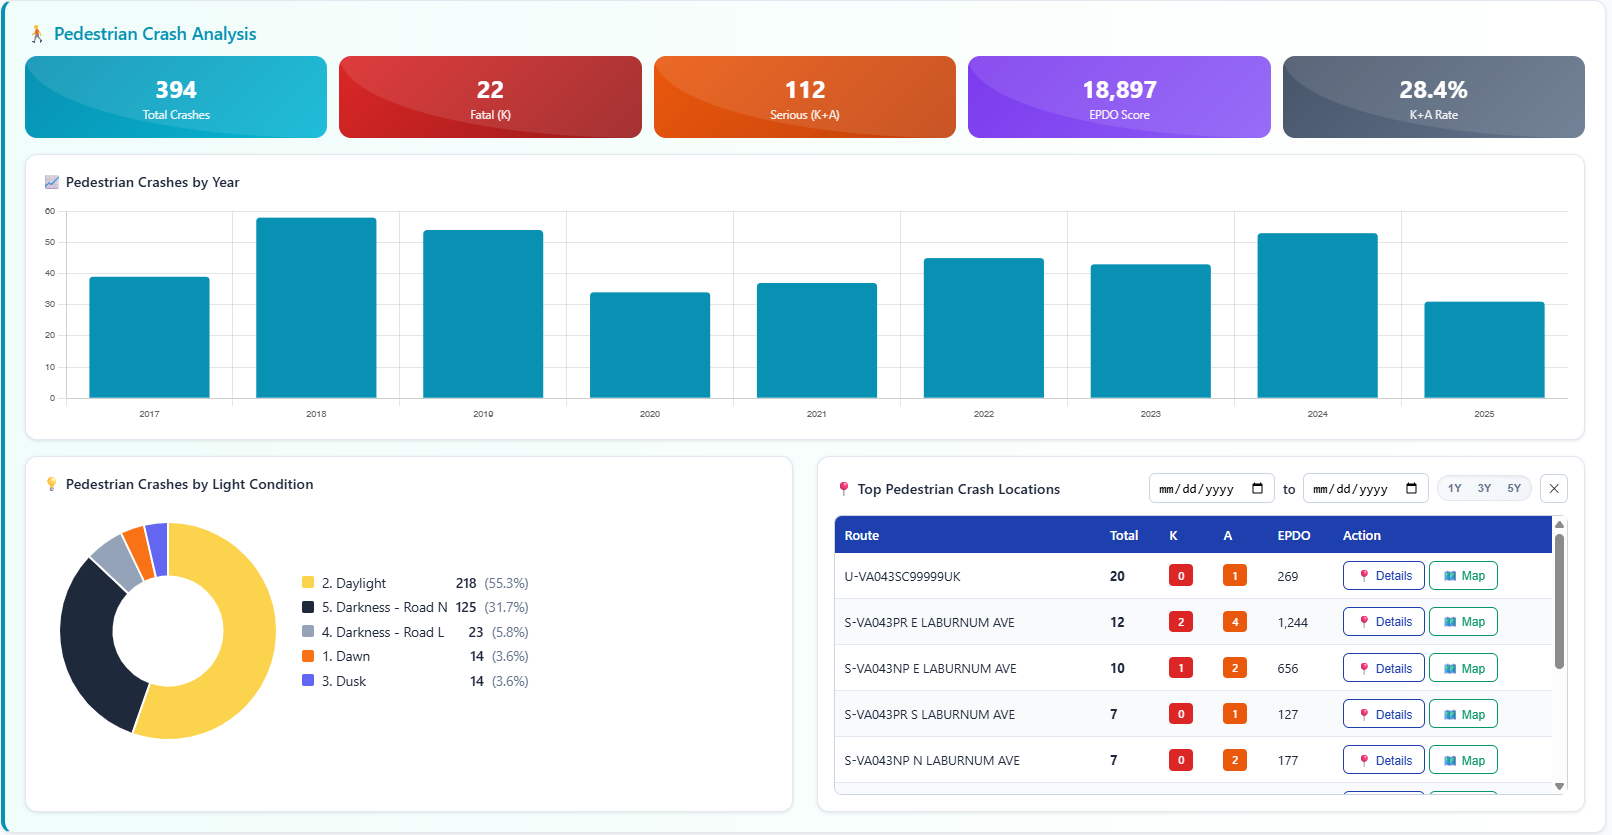
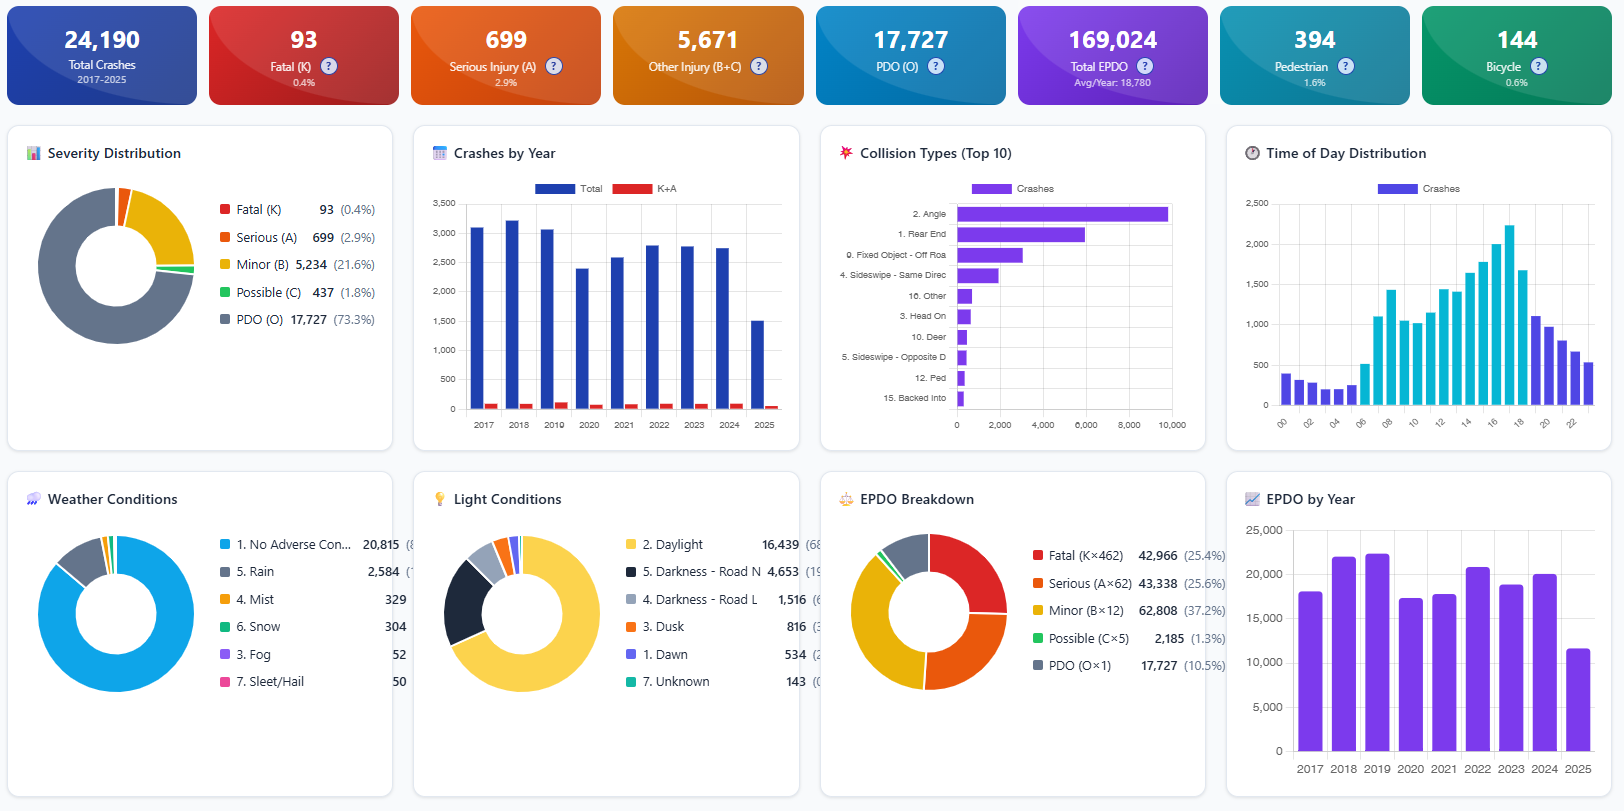
The same tool that helped Henrico County secure $2.4M in HSIP funding. Identify high-risk locations, generate MUTCD-compliant reports, and build winning grant applications.

No credit card required 14-day free trial Cancel anytime
CRASH LENS crash heat map showing high-risk intersections in Virginia
Add screenshot: data/images/hero-screenshot.png

Trusted by Virginia Transportation Professionals

Virginia DOT VDOT
Henrico County Henrico County
City of Richmond City of Richmond
Chesterfield County Chesterfield County
FHWA HSIP FHWA HSIP
12+ Virginia Agencies
$10M+ HSIP Funding Supported
500K+ Crashes Analyzed

See CRASH LENS in Action

Watch how traffic engineers use CRASH LENS to analyze crash data, identify hotspots, and generate reports in minutes

Watch the 2-Minute Demo See the complete workflow: Upload → Analyze → Report
0:00 Upload Virginia TREDS data
0:30 Filter by severity & location
1:00 Identify hotspots on map
1:30 Generate HSIP report

Powerful Features

Everything you need to analyze crash data and improve traffic safety

Crash Data Analysis

Comprehensive analysis of crash patterns, trends, and contributing factors with interactive visualizations.

Hotspot Identification

Identify high-risk intersections and corridors using advanced geospatial analysis and heat mapping.

AI Assistant

Get intelligent recommendations for safety countermeasures based on crash patterns and FHWA guidelines.

Signal Warrant Analysis

Automated MUTCD signal warrant analysis with comprehensive documentation and recommendations.

Report Generation

Generate professional PDF and Word reports for stakeholders, grant applications, and public meetings.

Grant Support

HSIP grant application assistance with crash data justification and benefit-cost analysis.

Proven Results from Virginia Agencies

Real case studies with real outcomes — see exactly how agencies used CRASH LENS to secure funding and save lives

Henrico County curve analysis heat map showing 60 identified locations
case-study-henrico.png
Roadway Departure Study

Henrico County Curve + Guardrail Analysis

"CRASH LENS helped us identify 60 curve locations with guardrail-related crashes in just 2 hours — analysis that previously took our team weeks."

60
Locations Found
2 hrs
vs. 2 Weeks
$2.4M
HSIP Awarded
Traffic Safety Engineer
Henrico County DPW
City of Richmond intersection analysis showing 142 signalized locations
case-study-richmond.png
Intersection Safety

City of Richmond Signal Analysis

"We analyzed rear-end and angle crashes at 142 signalized intersections. CRASH LENS flagged 8 for warrant re-evaluation and 12 for left-turn phase modifications."

142
Intersections
20
Issues Flagged
$1.8M
Safety Program
Traffic Operations Manager
City of Richmond DPW
VDOT Route 1 pedestrian crash heat map with time-of-day analysis
case-study-vdot.png
Pedestrian Safety

VDOT Salem District Corridor Study

"Time-of-day analysis revealed 68% of pedestrian crashes occurred between 6-9 PM, and 71% in dark conditions — directly informing our RRFB recommendations."

47
Crashes Mapped
68%
Night Pattern
4
RRFBs Funded
Senior Traffic Engineer
VDOT Salem District

How It Works

From data upload to HSIP application in four simple steps

1

Upload Data

Import Virginia crash data directly from TREDS or upload your own CSV/Excel files

2

Filter & Analyze

Apply multi-criteria filters by location, severity, collision type, and contributing factors

3

Identify Patterns

Use heat maps, charts, and AI insights to find crash patterns and high-risk locations

4

Generate Reports

Export professional reports for HSIP applications, stakeholder meetings, and grant justification

Calculate Your Time Savings

See how much time and money your agency could save with CRASH LENS

Your Current Workload

Intersection studies, corridor analyses, safety assessments
Average time including data gathering and report preparation
Including benefits and overhead
Federal grant applications requiring crash analysis

Your Estimated Savings

Hours saved annually
336 hours
Cost savings per year
$25,200
ROI with CRASH LENS
1,300%

* Based on 70% time reduction with CRASH LENS vs. manual analysis

500K+
Crashes Analyzed
150+
High-Risk Locations Found
$10M+
HSIP Funding Supported
35%
Avg. Analysis Time Saved

Simple Pricing

Full access. No feature limits. AI on every plan.

Free Trial

$0

14 days full access
AI: Bring your own key

Start Free

Team

$500/mo

Up to 5 users
500 AI queries/mo included

Get Started

View full pricing details →

Ready to improve traffic safety?

Start your 14-day free trial today. No credit card required.

Get Started Free